Latest News
See More News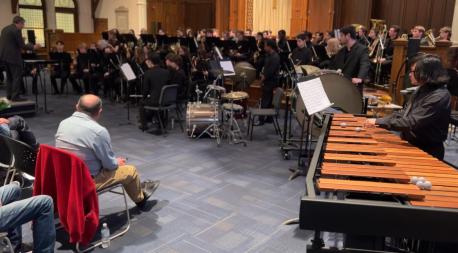


Real Projects. Real Experience. Real Impact.
At WPI, you’ll engage in hands-on collaborative projects from day one.


Pursue Your Passion
Robbie Oleynick ’24 integrates tech with music in the theatre

Innovation & Entrepreneurship
Freedom to innovate, the tools to create, and the support to make it happen

Find Your Niche


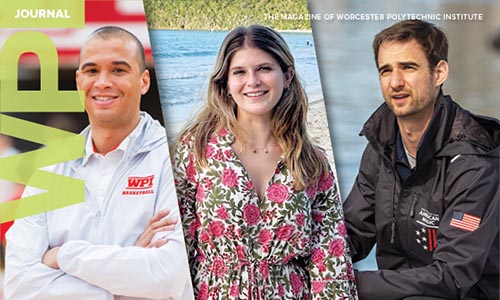
Features from the WPI Journal
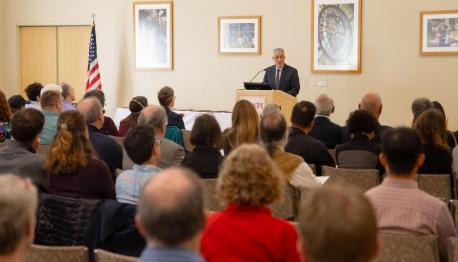
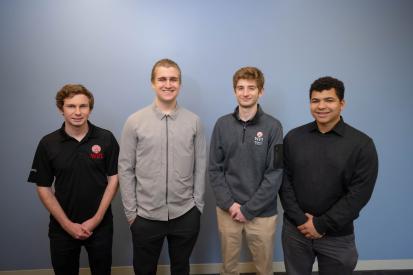
See how Liam Shanahan ’18 combines engineering and sailing skills to elevate the 2024 America’s Cup challenge; what’s behind Sol Giesso’s passion and focus on fighting climate change; and how an alumni trio is using AI to improve scrap metal recycling in the face of growing demand. There’s also an inside look at this year’s Commencement ceremony being held for the first time at the DCU Center; and how basketball led David Brown to a calling to leadership and management.