Why did you pick the branch of science you are in?
When I was an undergraduate, I wanted to become an actuary or work in computer graphics. One day I attended an on-campus symposium on data visualization, which showed me that you can use graphics to visualize data to empower people to understand complicated problems. I knew then that data visualization was something I wanted to explore further.
What are the biggest misperceptions people have about scientists?
That we sit in an ivory tower, ignoring the struggles people are facing in the world. Many scientists come from working class families and are actively working to make a difference, even if the impact won't be felt until many years in the future.
What’s something you do that reminds you that you are an #ActualLivingScientist?
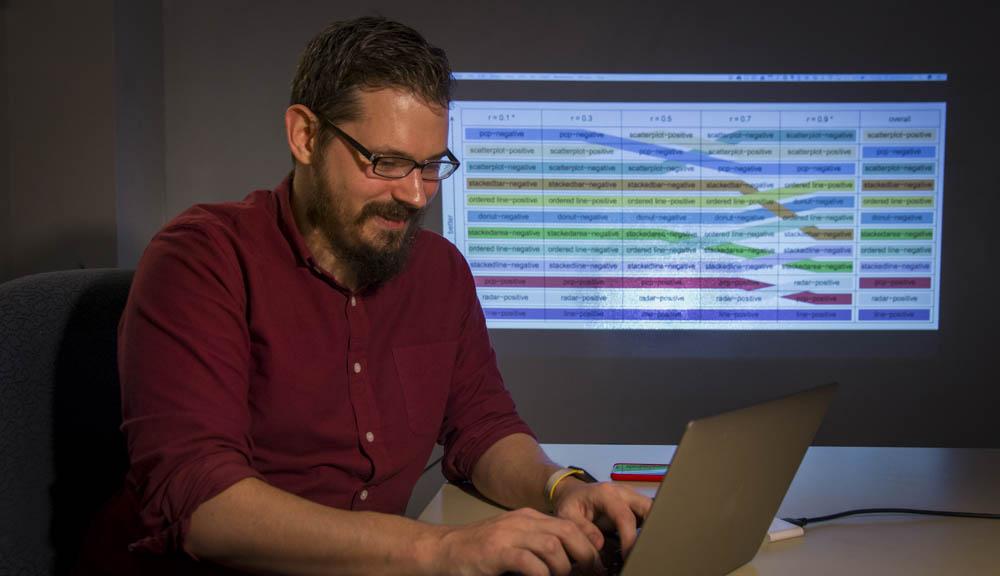
I study how people interpret and interact with data visualizations.
I am a scientist and I...
...failed a class in college.
How do you hope your scientific contributions will impact the world?
Data, collected and analyzed with integrity, can be a starting point for discussion among opposing worldviews, and I want to ensure that everyone has equitable access to it.
How has WPI helped you prepare students to become an #ActualLivingScientist?
WPI's unique project-based curriculum, particularly the IQPs and MQPs, are an ideal mechanism for integrating students in the data visualization research our lab is doing.