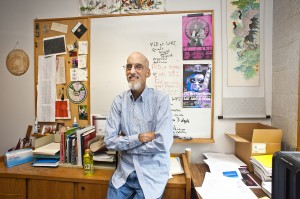
Professor Matt Ward doesn’t visualize himself losing interest in his field of study or retiring anytime soon. “I’ve been doing visualization for more than 25 years,” he says. “I expect that I will do this ’till I retire.”
 At WPI, visual analysis — the interactive graphical exploration of multivariate data — has mainly involved the development and testing of novel tools to examine this data in myriad ways. Ward and his research team have developed, primarily with support from the National Science Foundation, methods for visual exploration of datasets containing huge numbers of records and variables, including data with non-numeric fields, time-varying data, and data with variable uncertainty. He has received more than 4,000 citations to his work, and has recently published his second book on the subject.
“Medical data, analysis … social science, finance, earth sciences … anyplace where you’ve got a table of numbers, a spreadsheet, or a database,” Ward says of visualization. “I have yet to find a field where I couldn’t use it. I’ve seen it grow from a bunch of ad-hoc quasi-science to much more of a discipline.”
Visualization is the graphical depiction of data and information in order to communicate its contents and reveal patterns. It is sometimes referred to as visual data mining, or visual analytics.
This past spring, he was honored by WPI’s chapter of Sigma Xi as the senior faculty researcher for 2014. The multidisciplinary scientific research society, founded in 1886, has more than 500 chapters all over the globe. As a senior faculty researcher, he will serve as president of the chapter for one year, and will organize the 2015 recognition event. Ward was nominated by CS department head Craig Wills.
LONGTIME ENTHUSIAST
“Matt is one of a small set of researchers who have been actively publishing in information visualization for more than 20 years,” Wills wrote in Ward’s nomination paper.
The 59-year-old says he was invited to an awards luncheon in late April, and had some inkling something was afoot. “[Wills] dropped some hints, so I went into it thinking, ‘Oh, OK, I guess I’m old enough … that I would qualify,’” he says.
Ward, who earned an undergraduate degree from WPI in 1977, has been a member of the school’s faculty since 1986. In between, he worked in New Jersey, first for Bell Laboratories for four and a half years, then for a start-up firm for two years.
“I intended … to see what real life was about before coming into academics,” he says. “I think students have more confidence in a faculty member who spent time in the industry.”
He says he also made an effort to have all his sabbatical assignments be in industry, as well, putting in time with institutions such as The Commonwealth Scientific and Industrial Research Organisation, or CSIRO, in Australia, and the California-based high-performance graphics firm SGI.
 Ward was involved in the development of the field of visual analytics, Wills wrote in his nomination, “…which combines information visualization, statistics, and data mining, together with cognitive and perceptual psychology. He served on the committee that drafted the research agenda for the field … he is best known as the developer of the public-domain software system XmdvTool, which supports interactive visual exploration of tabular datasets.
He is aware that a nearly lifelong interest in one field like visualization is probably uncommon. “I would say I have many colleagues in the field for many years who have come and gone.” But, he says it’s more his style to stay with one area. Visualization continues to evolve and fascinate him.
“I am one of the old timers in the field,” he says.
— BY SUSAN SHALHOUB


 Dmitry Korkin, Danielle Cote, Emmanuel Agu, Carolina Ruiz, Pratap Rao")
