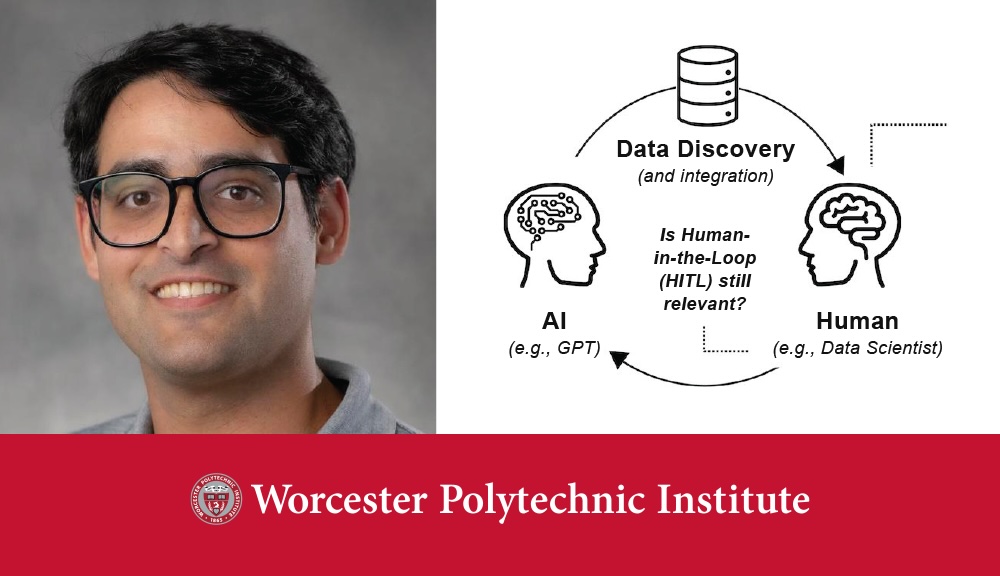
Lane Harrison

Professor Lane Harrison to Support Data Visualization Studies with NSF Grant

How we see and interact with information ripe for more robust look
September 19, 2022

Whether it’s polling numbers or voter turnout displays on a news website, public health COVID-19 vaccine messaging, or artificial intelligence interfaces, how data visualizations are presented can inform and influence important, and often critical, decisions.

Determining whether those presentations are effective—whether people got the message—takes time and an empirical approach. Associate Computer Science Professor Lane Harrison hopes to speed up that process by putting better tools into the hands of researchers who study the graphical representation of information using charts, graphs, animations, or maps. 

Harrison was recently awarded a $747,283 National Science Foundation grant to build research infrastructure that will aid the research community in the study and evaluation of data visualizations. 

The three-year grant, part of a broader collaboration with the University of Utah and the University of Toronto, will develop reVISit, a suite of web-based tools designed to accelerate and advance researchers’ ability to conduct crowdsourced studies of how people interact with visualizations in various fields. The work will essentially give researchers in the field off-the-shelf options for conducting state-of-the-art online experiments.

There’s a risk that we might share data in certain visual forms and not have the studies in place to know what is and isn’t effective, and why.
DEPARTMENT(S)
PROFILE(S)

Currently, the study of data visualizations is a labor-intensive field that requires a certain level of technical expertise to run experiments at scale. And it takes time to run a study, Harrison said—a year or more in many cases. The faster researchers can get a handle on what makes a visualization effective, the faster organizations, journalists, or public agencies will be able to adapt as the information landscape changes.

“The greater visualization community is putting more critical data and information into the hands of more people through visualizations than ever before,” Harrison said. “There’s a risk that we might share data in certain visual forms and not have the studies in place to know what is and isn’t effective, and why.”

The NSF grant will allow Harrison, WPI graduate students, and his partners to explore ways to use the best-available technologies—including speech-to-text, video recording, and cloud infrastructures—to produce high-quality visualization studies outside of the traditional laboratory setting.

“Our aim with this infrastructure is to support and amplify the important visualization research being done by other groups and labs, with the hope that the benefits circle back across the entire community and into practice,” Harrison said. 

See the WPI Expert Database

Are You a Journalist in Need of a Source?

Faculty members and senior administrators are available to offer ideas, opinions, analysis, and commentary on issues ranging from higher education to current events, trending topics, and breaking news.

Keep Up With WPI Research News

Want to learn more about Research at WPI? Subscribe to the monthly newsletter.